
I have another article that explains well about monitoring most of the mikrotik parts via nix base MRTG but it have lots of junk data too , curse upon WordPress who always messes with the coding and most of the time my hard work goes to TRASH :(
I will post updates
↓
# Enabling SNMP on Mikrotik
First Enable SNMP service (with public as community string or whatever you like on your mikrotik. Make sure no firewall rule is blocking SNMP traffic from/to the monitoring server.
Open Terminal in mikrotik and paste the following command. Or you can configure it via going to IP > SNMP
1 2 3 4 5 6 7 | /snmp communityset [ find default=yes ] addresses=0.0.0.0/0 authentication-password="" authentication-protocol=MD5 encryption-password="" encryption-protocol=DES name=public read-access=yes \security=none write-access=no/snmpset contact=Syed-Jahanzaib enabled=yes engine-id="" location=aacable-wordpress-com trap-community=public trap-generators="" trap-target="" trap-version=1[admin@MikroTik-2] /snmp> |
Now proceed further :)
↓
1. Monitoring Mikrotik Simple Queue with Linux base MRTG (for monitoring performance and track purposes)
↓
To monitor simple QUEUE via Linux base MRTG, you can use following config as an example :D
First you have to check your simple queue OID (numeric value which is used by MRTG to poll specific data from the remote server) in mikrotik. for example you have a queue to allow 100M for proxy cached marked packets.

Open Terminal and print OID for Simple Queue number 0 (your can be changed, but in general Queue for proxy hit packets should be on ** TOP ** )
1 2 3 4 5 6 7 | [admin@MikroTik] /queue simple printFlags: X - disabled, I - invalid, D - dynamic0 ;;; Simple Queue for squid Proxy CACHE HIT Packet Allow Unlimited Bandwidthname=SQ-for-cache-hit interface=all parent=none packet-marks=Cache direction=both priority=8 queue=default-small/default-small limit-at=0/0 max-limit=100M/100M burst-limit=0/0burst-threshold=0/0 burst-time=0s/0s total-queue=default-small |
Now check its OID value which will be used in MRTG to graph the values. Do remember, If you move/delete/add particular Queue , the oid value will change, simply note down new value and recreate graphs with the new values. Also on every system these OIDs are different, simply take a print oid to use them.
1 2 3 4 5 6 7 | [admin@MikroTik] /queue simple print oidFlags: X - disabled, I - invalid, D - dynamic0 ;;; Simple Queue for squid Proxy CACHE HIT Packet Allow Unlimited Bandwidthname=.1.3.6.1.4.1.14988.1.1.2.1.1.2.12534 bytes-in=.1.3.6.1.4.1.14988.1.1.2.1.1.8.12534 bytes-out=.1.3.6.1.4.1.14988.1.1.2.1.1.8.12534 packets-in=.1.3.6.1.4.1.14988.1.1.2.1.1.10.12534packets-out=.1.3.6.1.4.1.14988.1.1.2.1.1.11.12534 queues-in=.1.3.6.1.4.1.14988.1.1.2.1.1.12.12534 queues-out=.1.3.6.1.4.1.14988.1.1.2.1.1.13.12534 |
↓
As showed in the image below . . .

↓
Now we have to take bytes-in and bytes-out value for graphing purposes. which is in our case are
.1.3.6.1.4.1.14988.1.1.2.1.1.8.12534
.1.3.6.1.4.1.14988.1.1.2.1.1.9.12534
Now you can simply use the below CFG file to create Graphs for the mikrotik simple queue.
1 2 3 4 5 6 | Target[mikrotik-simple-queue-in-out]: .1.3.6.1.4.1.14988.1.1.2.1.1.8.12534&.1.3.6.1.4.1.14988.1.1.2.1.1.9.12534:public@10.0.0.1MaxBytes[mikrotik-simple-queue-in-out]: 100000000#Options[mikrotik-simple-queue-in-out]: bitsTitle[mikrotik-simple-queue-in-out]: Mikrotik QUEUE for Cache HITPageTop[mikrotik-simple-queue-in-out]: <H1>Mikrotik QUEUE for Cache HIT</H1>#Maintainer: Syed Jahanzaib |
↓
↓
SAMPLE GRAPH FOR THE SIMPLE QUEUE MONITORING VIA MRTG
↓
 .
.
.
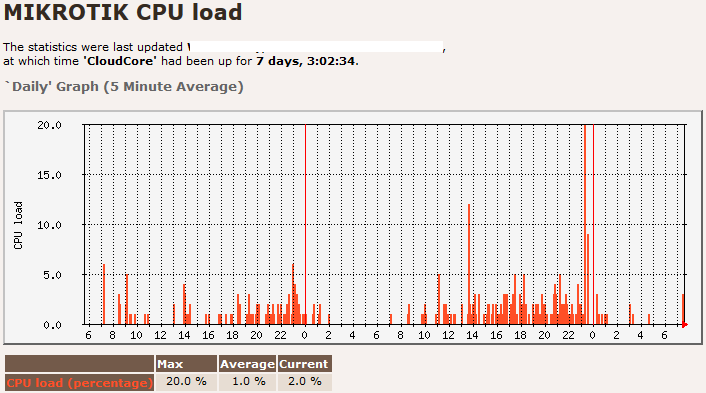
2. Monitoring CPU Usage
1 2 3 4 5 6 7 8 9 10 | ### MIKROTIK 10.0.0.1 CPU load ###Target[10.0.0.1_cpu]: 1.3.6.1.2.1.25.3.3.1.2.1&1.3.6.1.2.1.25.3.3.1.2.1:public@10.0.0.1AbsMax[10.0.0.1_cpu]: 100MaxBytes[10.0.0.1_cpu]: 100Title[10.0.0.1_cpu]: MIKROTIK CPU loadPageTop[10.0.0.1_cpu]: <H1>MIKROTIK CPU load</H1>Options[10.0.0.1_cpu]: gauge,growright,nopercent, nooYLegend[10.0.0.1_cpu]: CPU loadShortLegend[10.0.0.1_cpu]: %LegendI[10.0.0.1_cpu]: CPU load (percentage) |
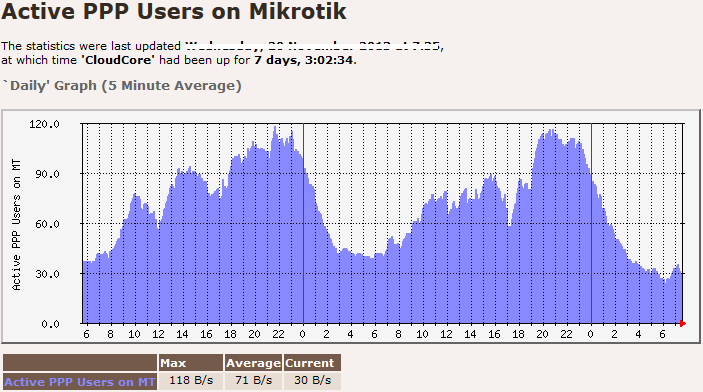
3. Monitoring Active PPP Users
1 2 3 4 5 6 7 8 9 10 11 12 | # Mikrotik PPP ACTIVE UsersTarget[mtpppusers]: 1.3.6.1.4.1.9.9.150.1.1.1.0&1.3.6.1.4.1.9.9.150.1.1.1.0:public@10.0.0.1Title[mtpppusers]: Active PPP Users on MTPageTop[mtpppusers]: <H1>Active PPP Users on MT</H1>MaxBytes[mtpppusers]: 300Colours[mtpppusers]: B#8888ff,B#8888ff,B#5398ff,B#5398ffOptions[mtpppusers]: gauge,nopercent,noo,integer,growrightLegendI[mtpppusers]: Active PPP Users on MTLegendO[mtpppusers]:YLegend[mtpppusers]: Active PPP Users on MTLegend1[mtpppusers]: Active PPP Users on MTLegend2[mtpppusers]: |
↓
As showed in the image below . . .
↓
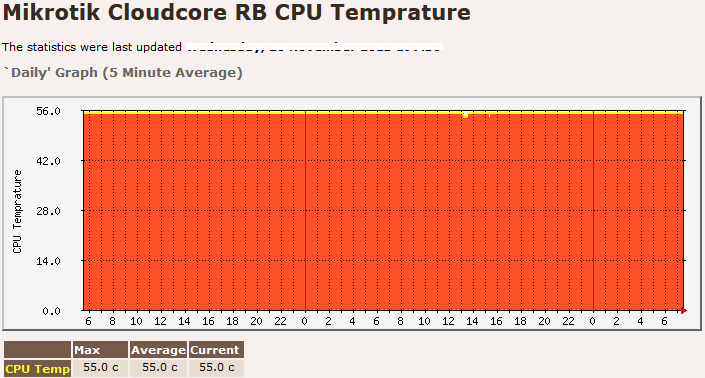
4. Monitoring RB CPU Temperature
1 2 3 4 5 6 7 8 9 10 11 12 13 14 | ### MONITORING Mikrotik CPU TEMP ###Target[mt.cpu.temp]: 1.3.6.1.4.1.14988.1.1.3.11.0&.1.3.6.1.4.1.14988.1.1.3.11.0:public@10.0.0.1Options[mt.cpu.temp]: gauge, growright, nopercent, noinfoMaxBytes[mt.cpu.temp]: 100Colours[mt.cpu.temp]: RED#ff4f27,Y#fffb15,RED#ff4f27,RED#fffb15#Unscaled[mt.cpu.temp]: dwmyYLegend[mt.cpu.temp]: CPU TempratureTitle[mt.cpu.temp]: Mikrotik RB CPU TempraturePageTop[mt.cpu.temp]: <H1>Mikrotik RB CPU Temprature</H1>ShortLegend[mt.cpu.temp]: cLegendI[mt.cpu.temp]:LegendO[mt.cpu.temp]: CPU TempLegend1[mt.cpu.temp]: CPU TempratureLegend2[mt.cpu.temp]: CPU Temprature |
As showed in the image below . . .
↓
5. Monitoring Routerboard Temperature
1 2 3 4 5 6 7 8 9 10 11 12 13 14 | ### MONITORING Mikrotik RB TEMP ###Target[mt.rb.temp]: 1.3.6.1.4.1.14988.1.1.3.10.0&.1.3.6.1.4.1.14988.1.1.3.10.0:public@10.0.0.1Options[mt.rb.temp]: gauge, growright, nopercent, noinfoMaxBytes[mt.rb.temp]: 100Colours[mt.rb.temp]: RED#ff4f27,Y#fffb15,RED#ff4f27,RED#fffb15#Unscaled[mt.rb.temp]: dwmyYLegend[mt.rb.temp]: RBTempratureTitle[mt.rb.temp]: Mikrotik Router Board TempraturePageTop[mt.rb.temp]: <H1>Mikrotik Router Board Temprature</H1>ShortLegend[mt.rb.temp]: cLegendI[mt.rb.temp]:LegendO[mt.rb.temp]: RB TempLegend1[mt.rb.temp]: RB TempratureLegend2[mt.rb.temp]: RB Temprature |
As showed in the image below . . .

↓
6. Monitoring Routerboard Voltage
1 2 3 4 5 6 7 8 9 10 11 12 13 14 15 | ### MONITORING Mikrotik VOLTAGE Monitor ###Target[mt-voltage]: .1.3.6.1.4.1.14988.1.1.3.8.0&.1.3.6.1.4.1.14988.1.1.3.8.0:public@10.0.0.1 / 10Options[mt-voltage]: gauge, growright, nopercent, noinfoMaxBytes[mt-voltage]: 1000Colours[mt-voltage]: RED#ff4f27,Y#fffb15,RED#ff4f27,RED#fffb15#Unscaled[mt-voltage]: dwmyYLegend[mt-voltage]: Voltaeg MonitorTitle[mt-voltage]: Mikrotik Cloudcore RB VOLTAGE MonitorPageTop[mt-voltage]: <H1>Mikrotik Cloudcore RB VOLTAGE Monitor</H1>ShortLegend[mt-voltage]: cLegendI[mt-voltage]:LegendO[mt-voltage]: VoltageLegend1[mt-voltage]: VoltageLegend2[mt-voltage]: Voltage |
As showed in the image below . . .

.
.
Regard’s
Syed Jahanzaib

Good Work!
Comment by Felipe Romero — October 31, 2013 @ 6:41 PM
Jahanzaib ap ka Email id mil sakhta hai …?
Comment by shani — December 23, 2013 @ 12:23 AM
aacable [at] hotmail . com
Comment by Syed Jahanzaib / Pinochio~:) — December 23, 2013 @ 8:14 AM
thank you Syed, it is really a great job.
can we have an addition how to install MRTG for monitoring MikroTik devices
Comment by Hatem Sabrey — November 20, 2014 @ 5:17 PM
You can do monitoring of your mikrotik devices as showed in this guide. What specifically you want to ask ? describe in details.
Comment by Syed Jahanzaib / Pinochio~:) — November 21, 2014 @ 12:46 PM
bro can we make mrtg graph for pppoe users
Comment by Muhammad Ismail — January 26, 2015 @ 12:47 PM